Roadify’s Transit Data Platform Feeds Real-Time Answers To Multiple Screens

Who will you meet?
Cities are innovating, companies are pivoting, and start-ups are growing. Like you, every urban practitioner has a remarkable story of insight and challenge from the past year.
Meet these peers and discuss the future of cities in the new Meeting of the Minds Executive Cohort Program. Replace boring virtual summits with facilitated, online, small-group discussions where you can make real connections with extraordinary, like-minded people.
Commuters are frustrated
Everyone in the world that takes public transportation does the same thing when they get to the station. They look down the track or street or across the river and wonder “what’s goin’ on?” Usually they see nothing and can’t find out anything.
There’s plenty of data, but it’s hard to find
It turns out there’s plenty of data available to answer the question but until recently it was difficult for riders to get this information in a way that’s relevant and meaningful. The open data movement and widespread adoption of Google’s General Transit Feed Specification (GTFS) as a data standard has made it easier for developers to work with this data. Many have built apps to provide transit info but few have multi-mode/multi-market scale that combines the best available data from multiple sources. Scale also provides the foundation for a robust, multi-stream revenue model which is necessary to support on-going product development and data management.
Data comes from many sources, in many formats
Public transit information comes in many flavors but it’s easiest to think of it as quantitative (when will it be here?) and qualitative (why is there a delay?). Both types of data can be real time and come either from official sources (transit agencies) or from riders themselves via Twitter and direct user comments. For example, bus location data produced by a GPS tracking system is real time, official and quantitative. A rider’s tweet describing a delay is real time, crowdsourced and qualitative.
A standardized portal for real-time official transit agency service advisories
Most transit agencies don’t have an easy way for their official service advisories to be displayed in Google Maps and disseminated to other outlets including their own websites, Facebook, Twitter and other apps. The result? A hodgepodge of tweets, RSS feeds and other fragmented advisories that riders often don’t get because of their limited distribution. Roadify has solved this problem by building a portal that agencies can use to create official service advisories and alerts and stage them for easy dissemination to all these outlets. The portal allows agencies to enter all this data in once and send the appropriate file type to the right place, whether it’s GTFS-real time, HTML, tweets, Facebook posts or even as push notifications in mobile apps. Roadify developed this portal with Veolia Transportation for its NICE (Nassau County, New York) bus system and it is available to agencies anywhere. For free.
Most apps are too narrowly focused, need scale to be viable
Most apps are local—focused on one transport mode or system or built by a single transit agency with only that agency’s data. Those with scale are being acquired by big companies like Apple (Embark, Hopstop) and Google (Waze). The best apps are those that provide riders with precisely the information they need at the “point of consumption”— when and where they need it, with minimal fuss and time spent for searching. Delivering a great user experience that keeps users coming back requires the right balance of high quality data, compelling design and broad distribution.
Riders want the dots connected and the information put together for easy consumption
Roadify takes a unique platform approach to providing high quality information and a compelling user experience. Roadify aggregates transit data from a myriad of sources and formats in more than fifty cities for distribution through multiple channels—mobile apps, web and on public signage. The result? By presenting the most relevant information contextually by route, riders are able to find out when their ride will arrive based on vehicle positioning data along with insight into delays as reported by other riders on the spot and official agency advisories—all are real-time sources that together, tell the complete story. This allows riders to quickly understand what’s going on and clearly see their options.
All in one place—one tap/one screen—keeps users coming back for more
The Favorites feature in the Roadify app allows riders to save their regular routes, stops and destinations in one place for easy access to the information they most regularly need. Riders can simply open the Roadify app and instantly see what they’re looking for. It’s a one-tap/one-screen user experience and metrics show the Roadify iPhone app enjoys user retention rates nearly 4x the average of other navigation apps.
Public signage— make it easy for riders to “look up” rather than “look it up”
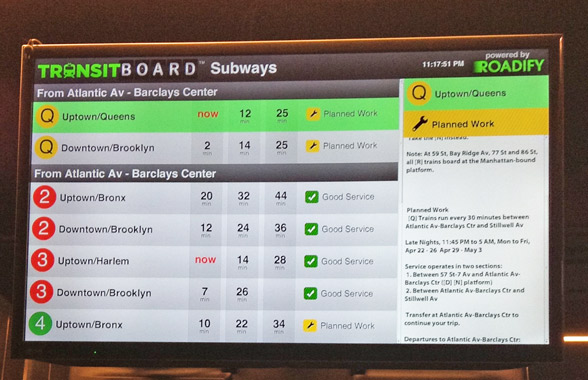
Roadify’s TransitBoard at Barclays Center
Ever notice that transit information is rarely displayed on public signage even at transit hubs and never at highly trafficked locations along transit routes? Roadify’s TransitBoard service addresses this issue. TransitBoard is a broadcast-ready feed of public transit arrivals and service advisories that can be displayed for any specific location on digital signs. Roadify is integrated into Cisco’s StadiumVision system and is live at Brooklyn’s Barclays Center where NYC subway, bus and Long Island Railroad information is broadcast on screens throughout the venue after events. An interactive version of TransitBoard can be seen in City 24 x 7 kiosks in downtown Manhattan, also using Cisco technology. These are the first places in New York City where real-time transit information is presented publicly to riders outside a major transit hub. TransitBoard is available to venues anywhere.
Aggregate the data—connect the dots—and answer the question
It’s really about answering a chronic, universal question—what’s goin’ on with my ride/when will it be here? By aggregating multi-mode/multi-source data and presenting it with relevance and meaning we can give riders greater confidence in public transit. The result is increased ridership, less traffic congestion and cleaner, safer cities that are easier to get around. It’s a simple idea when you think about it—billions of dollars are invested in rolling stock and infrastructure but there’s a missing layer of information about how to use transit services. In the last few years open data, mobile applications and smartphones along with increasingly ubiquitous digital signage displays are making it possible to connect riders to the information they expect.
Discussion
Leave your comment below, or reply to others.
Please note that this comment section is for thoughtful, on-topic discussions. Admin approval is required for all comments. Your comment may be edited if it contains grammatical errors. Low effort, self-promotional, or impolite comments will be deleted.
Read more from MeetingoftheMinds.org
Spotlighting innovations in urban sustainability and connected technology

Middle-Mile Networks: The Middleman of Internet Connectivity
The development of public, open-access middle mile infrastructure can expand internet networks closer to unserved and underserved communities while offering equal opportunity for ISPs to link cost effectively to last mile infrastructure. This strategy would connect more Americans to high-speed internet while also driving down prices by increasing competition among local ISPs.
In addition to potentially helping narrow the digital divide, middle mile infrastructure would also provide backup options for networks if one connection pathway fails, and it would help support regional economic development by connecting businesses.

Wildfire Risk Reduction: Connecting the Dots
One of the most visceral manifestations of the combined problems of urbanization and climate change are the enormous wildfires that engulf areas of the American West. Fire behavior itself is now changing. Over 120 years of well-intentioned fire suppression have created huge reserves of fuel which, when combined with warmer temperatures and drought-dried landscapes, create unstoppable fires that spread with extreme speed, jump fire-breaks, level entire towns, take lives and destroy hundreds of thousands of acres, even in landscapes that are conditioned to employ fire as part of their reproductive cycle.
ARISE-US recently held a very successful symposium, “Wildfire Risk Reduction – Connecting the Dots” for wildfire stakeholders – insurers, US Forest Service, engineers, fire awareness NGOs and others – to discuss the issues and their possible solutions. This article sets out some of the major points to emerge.

Innovating Our Way Out of Crisis
Whether deep freezes in Texas, wildfires in California, hurricanes along the Gulf Coast, or any other calamity, our innovations today will build the reliable, resilient, equitable, and prosperous grid tomorrow. Innovation, in short, combines the dream of what’s possible with the pragmatism of what’s practical. That’s the big-idea, hard-reality approach that helped transform Texas into the world’s energy powerhouse — from oil and gas to zero-emissions wind, sun, and, soon, geothermal.
It’s time to make the production and consumption of energy faster, smarter, cleaner, more resilient, and more efficient. Business leaders, political leaders, the energy sector, and savvy citizens have the power to put investment and practices in place that support a robust energy innovation ecosystem. So, saddle up.


0 Comments