Connecting the Dots Towards Well-Being

Who will you meet?
Cities are innovating, companies are pivoting, and start-ups are growing. Like you, every urban practitioner has a remarkable story of insight and challenge from the past year.
Meet these peers and discuss the future of cities in the new Meeting of the Minds Executive Cohort Program. Replace boring virtual summits with facilitated, online, small-group discussions where you can make real connections with extraordinary, like-minded people.
Every year, the U.S. Census Bureau fields more than 130 surveys, collecting literally hundreds of millions of data points that tell us how people in our country of nearly 320 million are faring. This is not counting other public, non-governmental and private data collection, from universities to marketing firms to tech companies. The growing availability of data is a boon for social science researchers, but making the scads of statistics result meaningful to a wide audience is challenging. This task—breathing life into numbers, drawing out the human stories that the data tell, and using those stories to inform dialogue and promote better policies—lies at the core of Measure of America’s work. In pursuit of this goal, we have learned a few lessons.
Information has never been as plentiful and accessible as it is today, yet important social issues often go unnoticed. Open and plentiful data, while necessary, is far from sufficient for a society to see, let alone understand and address, gaps in well-being and opportunity—even in a wealthy, technologically advanced country like the United States. Stimulating fact-based conversations around well-being and opportunity begins with providing data, but it can’t end there. The relationship most people have with numbers and statistics is a cold and distant one. While feeling connected to data sounds comical, there is a case to be made for bridging this rift between data and emotion. If data point us to the most pressing poverty, inequality, social, environmental, and other issues in our society, how can we take the next step and get others to care and to act?
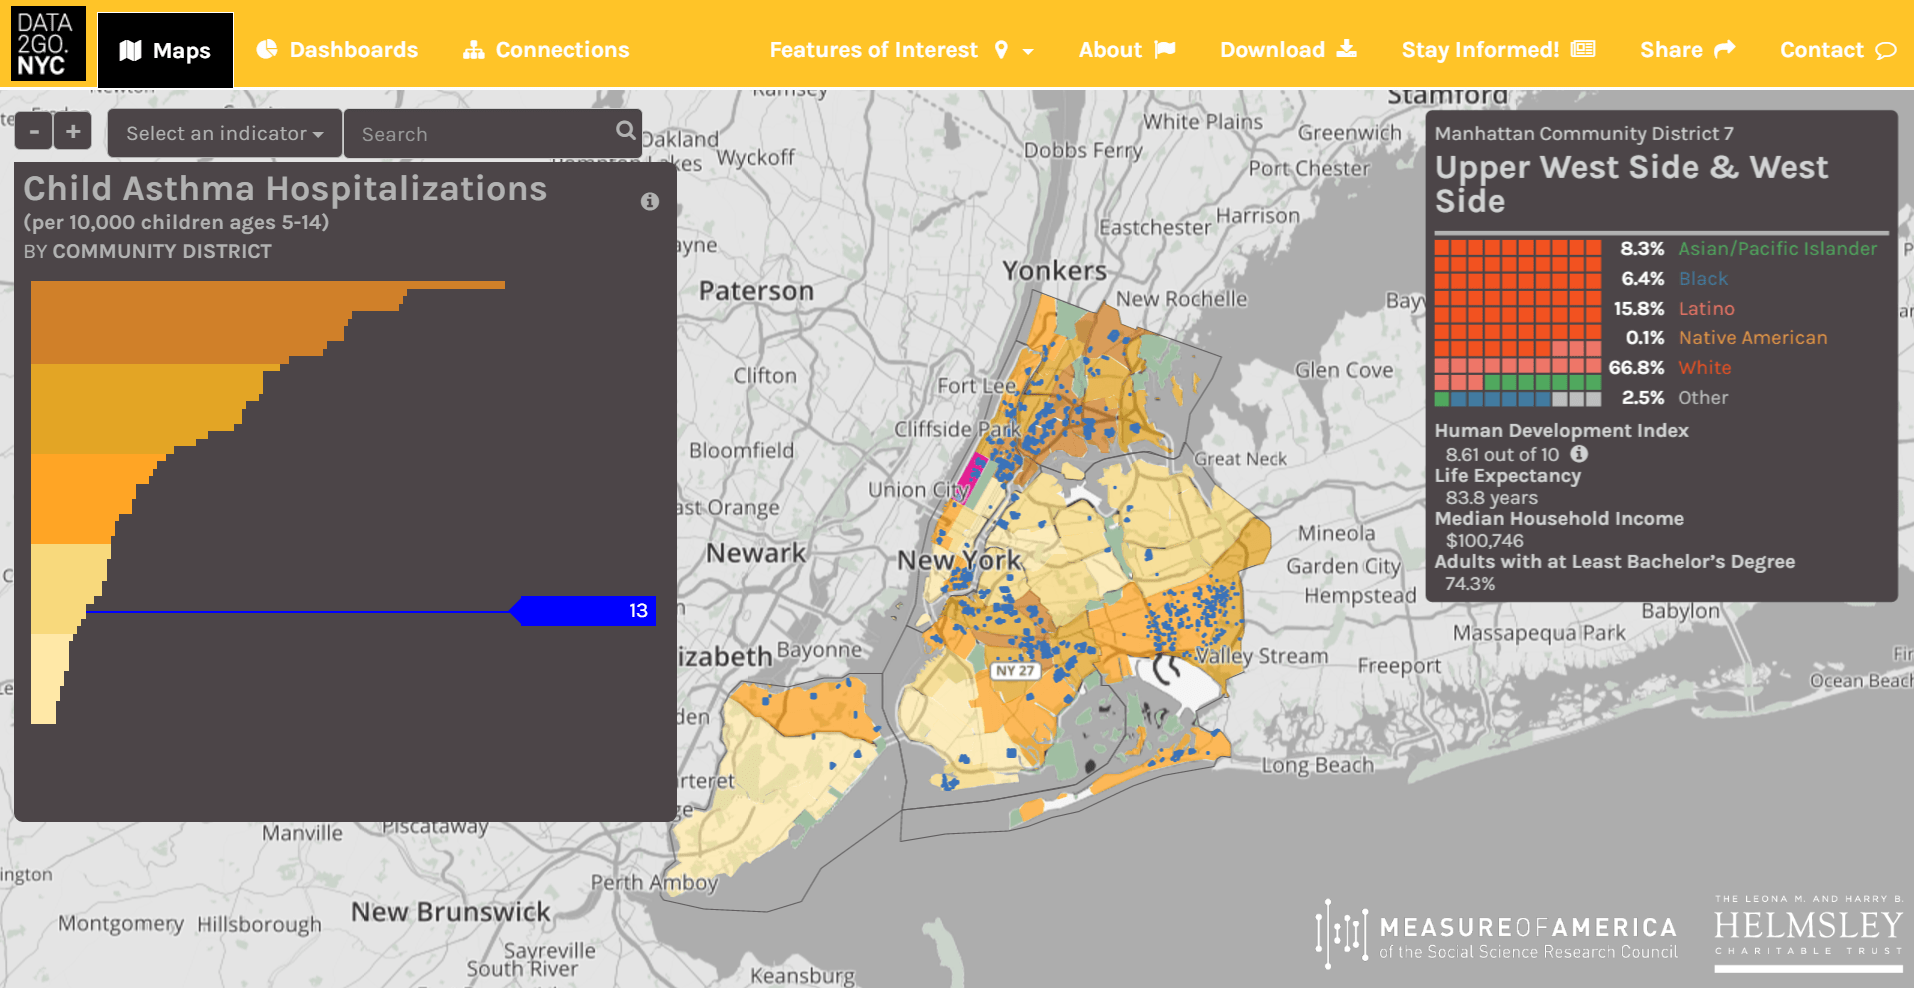
Breathing life into numbers means creating connections—between data points to tell stories, between partners to create relationships, and between diverse sectors to maximize the positive impact of well-being initiatives. DATA2GO.NYC, Measure of America’s data-mapping tool for New York City, exemplifies this philosophy of making connections. The concept of the tool itself is to bring together data collected from different sources, at different levels—federal, state and local—and across different sectors, in a platform that facilitates storytelling and encourages users to explore how different factors like housing, health and education, among many others, are related to others such as crime, the environment, and employment.
From the beginning, DATA2GO.NYC was shaped by a collaborative process that brought together people from New York City government agencies, issue-based advocacy groups, service providers, community-based organizations, universities, data visualization firms, and philanthropy.
DATA2GO.NYC continues to be shaped by collaboration with subject experts and those on the ground who know their communities intimately. For example, in partnership with the Human Services Council, MoA is holding a “mini-portraits” of New York challenge, in which local human service delivery organizations, together with local residents, are creating portraits of their communities that illuminate a particular issue using data from DATA2GO.NYC. These data-based portraits will take a deep dive into a range of issues, among them gaps in early childhood care for non-English speaking families, the low rates of physical activity among Asian American seniors, and a video by teenagers that expresses their vision of how their community can thrive amid rapid gentrification.
Another example is interactive workshops on DATA2GO.NYC that our team provides with organizations around the city, which provide them with a comprehensive tour of the tool and us with feedback on how organizations use it and how we can make DATA2GO.NYC even better.
The collaboration between those with the bird’s-eye view data provides and those on the ground who can use the data to make change is essential to ensure that statistics don’t just sit in servers. For his annual State of the District event, for example, New York City Councilmember Robert E. Cornegy, Jr. used Data2Go.NYC to identify some of the strongest assets and most serious challenges faced by residents in Brooklyn’s Bedford Stuyvesant and northern Crown Heights and organized an event as a call for action. The rate of home fires is very high, so he brought in the Fire Department of New York and Red Cross to distribute free smoke detectors. Voting rates are very low, so the district partnered with the NAACP and others to increase voter registration.
Beyond our collaboration with others, the design of the tool is deliberately meant to foster cross-sector collaboration by presenting data from different sectors side by side. A map of public housing locations alone may be informative. But a map of public housing locations overlaid with the prevalence of child asthma hospitalizations can illustrate and give validity to the story many New Yorkers in public housing experience—asthma attacks triggered by mold, cockroaches and decaying infrastructure, and neighborhoods more likely to be located near waste transfer stations, bus depots and other facilities that contribute to poor air, exacerbating the likelihood of an attack. Placing these data on a single platform where they can be overlaid and correlations can be tested encourages users to explore data and collaborate beyond their narrow areas of expertise. What is typically seen as a health issue may be more effectively addressed if it’s also considered a housing issue, for example.
DATA2GO, with its multiple visualization options and 360+ indicators, provides a nuanced palette to paint the pictures of the thousands of New Yorks that make up this great city in factual, detailed ways. Without active, engaged users, DATA2GO.NYC is a passive repository of data. With them, it is a rich, responsive tool for understanding and change-making. DATA2GO.NYC depends on its users engaging meaningfully with the data—bringing knowledge and curiosity, looking for connections, remaining open to learning and challenging assumptions, and most importantly, telling stories.
Data, on its own, does not automatically lead to understanding, let alone to action. Creating connections is what ultimately can leverage the data to bring important social issues to the fore, influence funding decisions, and inform policies for positive change.
About the Authors:
 Marina Recio is Program Assistant for Measure of America. She assists with qualitative and quantitative analysis in support of Measure of America’s work. Among her other duties, she tends to the budget, logistics, and online presence of Measure of America. She recently graduated Phi Beta Kappa from Fordham University with a BA in Political Science and Communication and Media Studies.
 Kristen Lewis is Co-Director of Measure of America. Before founding Measure of America, Kristen was senior policy advisor to the water and sanitation task force of the UN Millennium Project. She previously worked at the United Nations for many years, first with UNIFEM and then as in UNDP’s policy bureau, and has served as a consultant on gender equality issues for numerous international development organizations, including UNICEF and UNFPA. She received a Master in International Affairs degree from Columbia University.
 Sarah Burd-Sharps is Co-Director of Measure of America. Prior to this position, Sarah worked for the United Nations for over two decades, with a focus on economic empowerment, democratic, governance, and gender equity. Before she left the UN in 2007 to found Measure of America, she was Deputy Director of the UN Development Program’s Human Development Report Office, where she led the UN’s work on national human development reports on every continent. She received a Master in International Affairs degree from Columbia University.
Discussion
Leave your comment below, or reply to others.
Please note that this comment section is for thoughtful, on-topic discussions. Admin approval is required for all comments. Your comment may be edited if it contains grammatical errors. Low effort, self-promotional, or impolite comments will be deleted.
3 Comments
Submit a Comment
Read more from MeetingoftheMinds.org
Spotlighting innovations in urban sustainability and connected technology

Middle-Mile Networks: The Middleman of Internet Connectivity
The development of public, open-access middle mile infrastructure can expand internet networks closer to unserved and underserved communities while offering equal opportunity for ISPs to link cost effectively to last mile infrastructure. This strategy would connect more Americans to high-speed internet while also driving down prices by increasing competition among local ISPs.
In addition to potentially helping narrow the digital divide, middle mile infrastructure would also provide backup options for networks if one connection pathway fails, and it would help support regional economic development by connecting businesses.

Wildfire Risk Reduction: Connecting the Dots
One of the most visceral manifestations of the combined problems of urbanization and climate change are the enormous wildfires that engulf areas of the American West. Fire behavior itself is now changing. Over 120 years of well-intentioned fire suppression have created huge reserves of fuel which, when combined with warmer temperatures and drought-dried landscapes, create unstoppable fires that spread with extreme speed, jump fire-breaks, level entire towns, take lives and destroy hundreds of thousands of acres, even in landscapes that are conditioned to employ fire as part of their reproductive cycle.
ARISE-US recently held a very successful symposium, “Wildfire Risk Reduction – Connecting the Dots” for wildfire stakeholders – insurers, US Forest Service, engineers, fire awareness NGOs and others – to discuss the issues and their possible solutions. This article sets out some of the major points to emerge.

Innovating Our Way Out of Crisis
Whether deep freezes in Texas, wildfires in California, hurricanes along the Gulf Coast, or any other calamity, our innovations today will build the reliable, resilient, equitable, and prosperous grid tomorrow. Innovation, in short, combines the dream of what’s possible with the pragmatism of what’s practical. That’s the big-idea, hard-reality approach that helped transform Texas into the world’s energy powerhouse — from oil and gas to zero-emissions wind, sun, and, soon, geothermal.
It’s time to make the production and consumption of energy faster, smarter, cleaner, more resilient, and more efficient. Business leaders, political leaders, the energy sector, and savvy citizens have the power to put investment and practices in place that support a robust energy innovation ecosystem. So, saddle up.


While I love data like the next nerdy urban planner, the driver for educating and inspiring the general public is not numbers, its story. Thus the entry point for analysis as well as promotion of new ideas is narrative, which is then supported by data, which plays a role in storytelling much like characters, setting, and goals.
Great article and great use of data. Need to be teaching many more people to use data platforms like yours to create on-going stories that motivate people to be involved in solving problems where the data indicates a problem (or opportunity) exists. I added link to this story in my blog at http://mappingforjustice.blogspot.com
Fay — thanks for your comment. You’re absolutely right, a good narrative and the use of stories are sometimes worth a thousand data points! We have found that designing our data tools, so they fit the needs of those who tell stories–community organizations, journalists, activists–and turn data into action is as important as the data itself. Making sure stories are underpinned by the highest quality of data makes for fact-based compelling debates and helps people look at issues in new ways.